VOO vs SPY: Comprehensive Review of Two S&P 500 ETFs
VOO (Vanguard S&P 500 Index ETF) and SPY (SPDR S&P 500 Index ETF) are two of the most popular ETFs (exchange-traded funds) in the world. This article will contrast VOO vs SPY so you can decide which is best for your portfolio.
Contents
Introduction
Each of these funds:
- Attempts to replicate the performance of the S&P 500 Index
- Is tax-efficient due to lower than average turnover
- Has a lower expense ratio than actively managed mutual funds
As a result, either of these equity ETFs are great options for long term investors who want to drive down the costs of their portfolio. However, since they largely do the same thing, owning both ETFs is likely to be counterproductive.
If an investor had to select the best S&P 500 index fund, it would have to be the one with the lowest expense ratio. As it currently stands, the better ETF would be VOO.
Fees aside, SPY & VOO are two of the best ETFs out there, with few minor differences.
This article will explore both funds in depth. Specifically, we will discuss each fund’s:
- Investment focus
- Relative performance
- Investment holdings & size
- Fees, turnover & tax impact in an investment portfolio
We’ll also talk about where everyday investors can purchase these funds.
Let’s begin by discussing the investment focus of these ETFs
Investment Focus
Both VOO and SPY are index funds whose investment objective is to track the Standard & Poor’s 500 Index. Both VOO and SPY purchase individual stocks from the S&P 500 Index in relatively equal proportions.
VOO and SPY focus on replicating the S&P 500, not outperforming it. This leads us to wonder what exactly is the S&P 500 Index?
What is the S&P 500 Index?
The S&P 500 is one of the world’s oldest stock indices, and arguably one of the most famous. Created by Standard and Poor’s (now known as S&P Global) in 1957, the S&P 500 Index represents the 500 largest publicly traded U.S. companies.
As of the quarter ending 3/31/2022, the S&P 500 Index had 505 U.S. companies representing approximately $40.3 trillion in market capitalization.
As of 2/28/2022, VOO held individual stocks in 507 publicly traded U.S. companies. Meanwhile, SPY had 505 individual stocks in its fund as of 3/31/2022.
Why is the S&P 500 so popular?
There are probably three reasons why the S&P 500 Index is one of the world’s most popular indices.
1. It’s in the United States
The United States stock market is the largest stock market in the world. Actually the U.S. stock market is comprised of several exchanges, such as:
- New York Stock Exchange
- American Stock Exchange
- NASDAQ
- Other stock exchanges
All of these exchanges represent the most investment opportunities for the most investors. The US stock market provides investment opportunities to everyone.
From options traders to institutions and active traders looking to perform big block trades, to retail investors–there’s a place in the U.S. stock market for everyone. And the S&P 500 is arguably the most popular index of them all. Since it’s one of the oldest.
2. The S&P 500 is one of the oldest indices
According to Investopedia, there are approximately 5,000 different indexes in the United States. The three most popular indices are the S&P 500, Dow Jones Industrial Average (the Dow), and the NASDAQ 100.
The S&P 500 isn’t the oldest index in the United States. That distinction belongs to the Dow. The Dow was created in 1896, and is the United States’ second oldest continuous index (next to the Dow’s Transportation Index).
However, the S&P 500 was created in 1957, which still makes it substantially older than most of the other indexes that exist. Additionally, it’s a little more diversified than the Dow.
3. It’s more diversified than the Dow Jones Industrial Average
There are two noticeable differences between the Dow and the S&P 500.
The S&P 500 has more companies
The Dow has 30 of the largest companies in America. However, they are not the 30 largest companies. Dow components (as these companies are often called), happen to be large-cap U.S. stocks that give a relatively good indication of the U.S. economy.
As the corporate sector evolves, so does the Dow. In recent years, Dow components have started to represent the biggest companies in health care and the technology industries. The Dow can go years without making a change to its component companies.
Conversely, the S&P 500 Index is strictly comprised of the 500 largest companies in the US stock market, by market capitalization. Every year, the S&P 500 is updated as different companies fall in value, and others take their place.
The S&P 500 companies comprise almost 90% of the total market capitalization of the entire U.S. equity market.
Index weighting
The Dow is a price-weighted index. This means that the number you see on the stock ticker represents the combined prices of the 30 companies in the index, divided by an adjustment factor (known as the Dow divisor). This adjustment factor represents different corporate actions, such as spinoffs and dividend payments.
And since the price weights the index, the ‘biggest’ company in the index is the one with the largest stock price. Right now, United Health Group ‘weighs’ more than Apple, even though Apple is 5 times larger (by market capitalization).
Also, on any given day, the smallest company in the Dow can move the average just as much as the largest. For example, if Walgreens’ stock price goes up by a dollar, but United Health Group goes down by a dollar, then those price changes cancel each other out.
Conversely, the S&P 500 is a market cap-weighted index. This means that each company is represented in the index in proportion to their total size. For example, Apple, the largest company in the S&P 500, is larger than the bottom 180 stocks in the index combined.
We’ll see how the S&P 500 holdings look, and how VOO and SPY stack up next to them.
Holdings Comparison
The holdings of each of these funds are virtually identical. Let’s take a closer look at the top ten holdings in the S&P 500, followed by each ETF.
S&P 500 Top Ten Holdings
Tech companies dominate the S&P 500 top ten. In fact, only Berkshire Hathaway and United Health Group really stand out as non-tech companies.
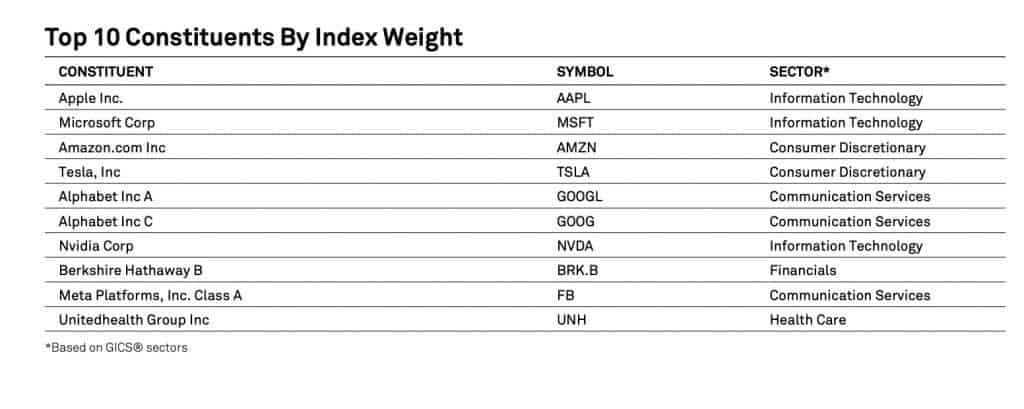
The top 10 components represent approximately 28.5% of the overall S&P 500 Index. Let’s see how VOO compares.
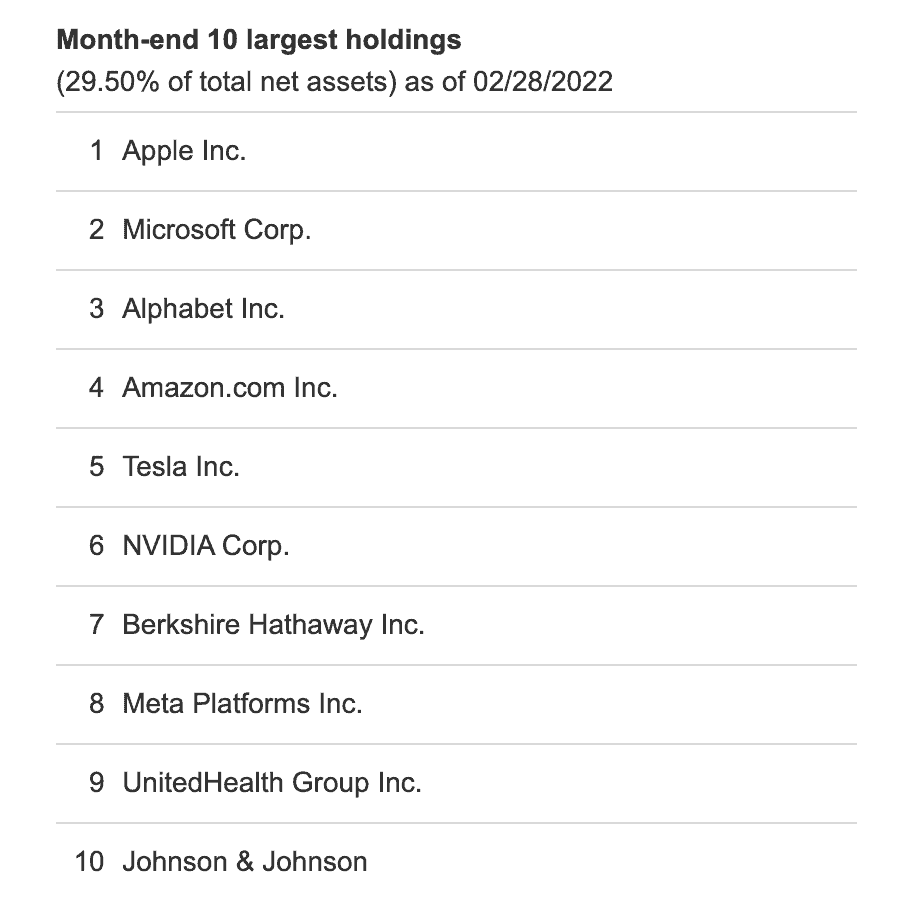
VOO’s Top Ten Holdings
Like the S&P 500, tech companies dominate the top ten in VOO. As of 2/28/2022, VOO’s top ten comprised about 29.5% of the overall fund. This makes it fairly similar to its underlying index.
SPY’s Top Ten Holdings
Like VOO, tech companies dominate the top ten in VOO. As of 04/13/2022, SPY’s top ten comprised about 28.5% of the overall fund. Here is a side by side comparison of SPY and the S&P 500 index.
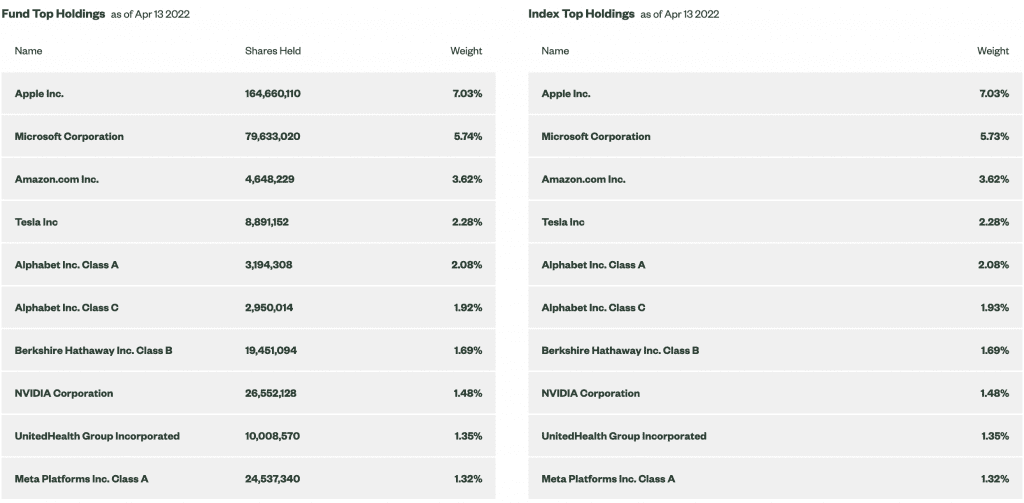
As you can see, these are virtually identical. And in line with VOO’s. Below is a side by side comparison of VOO and SPY.
| Fund | Top 10 holdings | Remaining number of companies | Remaining companies (%) |
| VOO | 29.50% | 497 | 70.50% |
| SPY | 28.50% | 495 | 69.50% |
Let’s take a look at the overall holdings, by sector, of the S&P 500 Index. Since both SPY and VOO track the S&P 500, each fund’s holdings is represented by a pie chart from its respective index, to make it easier to visualize.
Overall Holdings
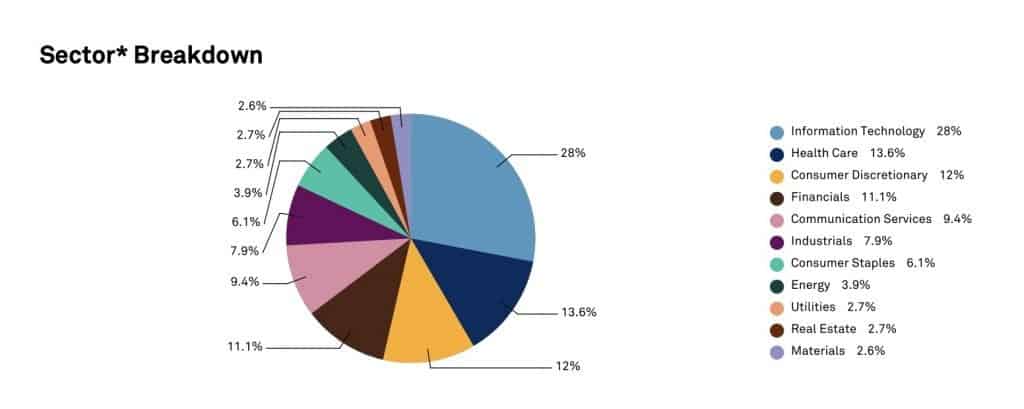
In the S&P 500, the tech sector reigns supreme (28% of holdings), followed by health care (13.6%), consumer discretionary goods (12%), and financials (11%).
Overall, a fair representation of the 500 biggest companies in the United States.
Growth vs. value stocks
Each fund is a passive index fund. As a result, neither fund tries to achieve a slant towards growth or value. But since the S&P 500 is a market-cap weighted index, you might find that these funds tilt slightly more towards large-cap growth rather than value stocks.
Market capitalization
It’s easy to generalize the S&P 500 as an index that focuses only on large-cap U.S. stocks. It does, by definition, contain all of the publicly traded large-cap U.S. stocks. However, it contains some mid-cap size stocks as well.
According to Investopedia, mid-cap stocks are those with between $2 billion and $10 billion in market capitalization. As of January 2022, approximately 20-25 companies fit that criteria, with another 20 that are between $10 billion and $12 billion.
So generally, the S&P 500 has about 5% of its total companies (perhaps as much as 10%, depending on a stock market correction), that are mid-cap companies. Since it’s a market cap weighted index, virtually any movement of these companies is nullified by the fortunes of Apple, Tesla, and the rest of the top ten.
Let’s look at the total assets under management (AUM).
AUM Comparison
Vanguard’s index funds are some of the most popular funds in the world. Whether you’re discussing mutual funds or ETFs, their low fees make them highly desired, particularly by new investors.
State Street Global Advisors, which manages SPY, isn’t as well known to the average consumer as Vanguard. However, it is just as recognizable to institutional investors. And SPY was created in January 1993, making it the United State’s first ETF (and one of the oldest ETFs in the world).
As they both track the S&P 500 Index, SPU and VOO are two of the largest ETFs offered by two of the largest ETF issuers in the world.
VOO
VOO weighs in at $808 billion under management. However, this includes Vanguard’s flagship S&P 500 mutual fund, VTSAX.
According to ETF Database, which maintains a list of the top 100 ETFs by assets under management, VOO manages about $286.6 billion. This makes it the world’s 4th largest ETF by size.
SPY
In comparison, SPY manages about $410.1 billion. This makes it the world’s largest ETF, just ahead of iShares Core S&P 500 Index (IVV), at $331.3 billion.
Let’s take a look at each funds’ performance, both relative to their benchmark index as well as absolute performance.
Performance comparison
Before we dive in, both SPY and VOO are passive index funds. Their goal is to track the performance of the S&P 500 Index. There isn’t much difference between the funds and the index
But these funds’ returns will always underperform the index based on two factors: management fees & taxes.
Expense ratios
Also known as management fees, expense ratios are taken from the investment to cover the operating costs of the fund. Usually, expense ratios are reflected by an adjustment to the end of day share price.
An advantage of an index fund over similar funds is that you do not have to pay an active fund manager, investment analysts, or other staff to manage the investments. So when it comes to passive investing, low fees make index funds a good choice for many investors.
The expense ratio for VOO is 0.03%. That means for every $10,000 invested, Vanguard takes $3 per year. For comparison, most financial advisors consider a fund to be relatively inexpensive if the fund’s expense ratio is less than 1% per year.
SPY’s expense ratio is 0.09%. So for every $10,000 invested, State Street takes $9 per year.
Many investors might balk at why SPY costs 3 times as much as Vanguard. In a $1 million portfolio, that difference could mean up to $6,000 over a 10 year period.
That seems like a decent amount of money. But here are two considerations:
Capital gains often might not be worth the switch.
If you’ve got these investments in a Roth IRA or 401k plan, go ahead and make the switch to lower fees. But if SPY has been a core holding in your taxable account for a long time, it probably won’t be worth the capital gains taxes.
You’ll get similar returns without having to worry about the taxes right now. And both funds are cheaper than what else is out there.
Either fund is much cheaper than alternatives focusing on the same objective.
While that $6,000 isn’t chump change, either fund is considerably less expensive than a fund charging 1% over that time (which would mean as much as $100,000 in that million dollar portfolio).
The other factor worth considering is portfolio turnover, which creates tax drag.
Tax drag
Both mutual funds and ETFs participate in taxable events, including capital gains harvesting or receiving dividends from the underlying companies.
It’s hard to view the impact of taxes on annual returns because neither State Street nor Vanguard pay taxes on these events. These transactions are passed on down to the investor.
And in tax-deferred accounts, these events don’t matter at all.
Dividends
In most investment accounts, it’s hard to notice. Each quarter, you’ll see quarterly dividend transactions for each of the mutual funds or ETFs in your investment portfolio.
If your fund has a low proportion of dividend-paying stocks, you’ll probably see a low payout. But in taxable investment accounts, you will pay taxes on these dividends.
This could be qualified dividends (subject to capital gains tax), ordinary dividends (subject to income tax at ordinary income tax rates), or a combination of both.
Capital gains distributions
And at the end of the year, normally towards the end of December, you’ll see capital gains distributions in each of your funds. The amount of distributions depends on the amount of activity in your fund.
If your fund has high turnover, you’ll likely be subject to a lot of capital gains distributions. High turnover means an active fund manager is consistently buying and selling the underlying securities within the fund. Those capital gains are required to be passed on to the investor.
Fortunately, index funds are subject to relatively minimal turnover. Each of these indices is reset annually. And the rebalancing in the funds is done quarterly. So there isn’t a lot of buying and selling. So less impact on your performance.
You won’t see the impact of taxes on your fund’s performance. But tax efficiency should be a consideration for your overall investment performance.
Let’s take a look at the relative performance of each fund (minus management fees), compared to its underlying index.
VOO vs. SPY vs. S&P 500 Index
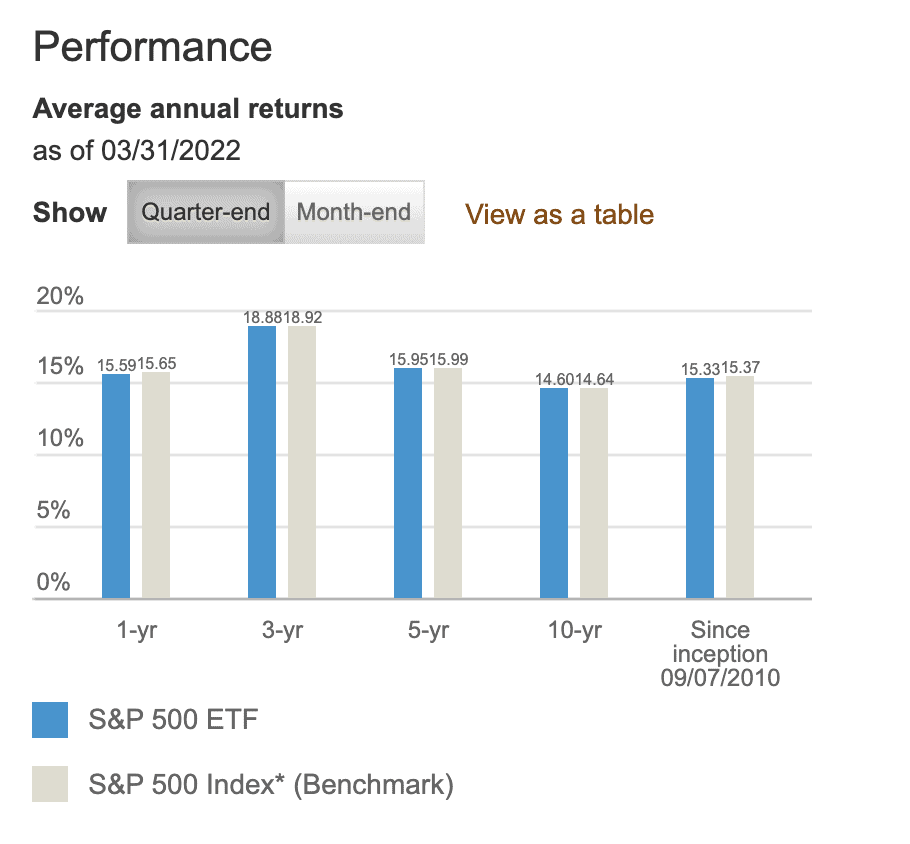
Here is the breakdown of VOO’s annual investment performance over the past year, 3 years, 5 years, and over its history:
- 1-year: 15.59%
- 3-year: 18.88%
- 5-year: 15.95%
- 10-year: 14.60%
- Since inception: 15.33%
Similarly, VOO’s performance slightly trails the S&P 500 Index, with expense ratios presenting the only difference.
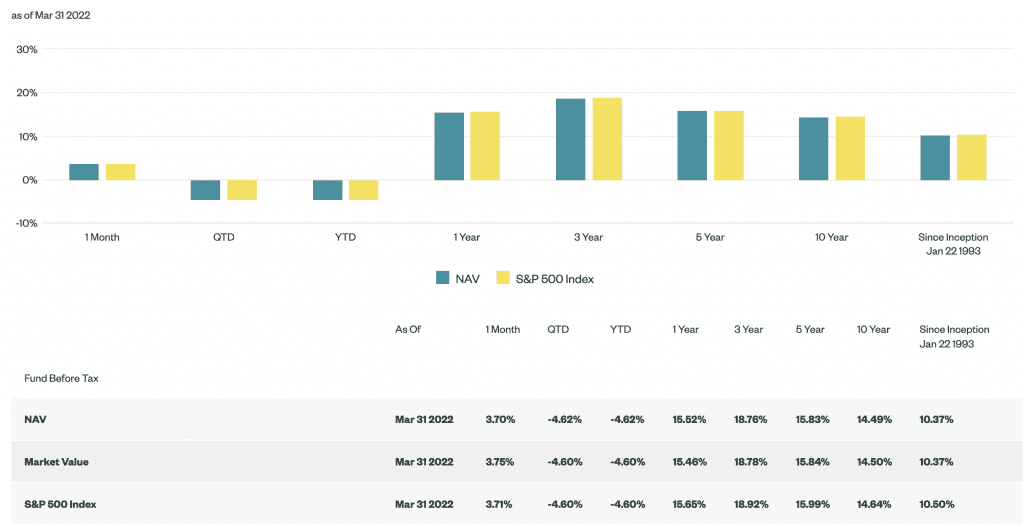
In comparison, here is the breakdown of VOO’s annual investment performance over the past year, 3 years, 5 years, and over its history:
- 1-year: 15.52%
- 3-year: 18.76%
- 5-year: 15.83%
- 10-year: 14.49%
- Since inception: 10.37% (inception was in 1993, vs. 2010 for VOO)
Since both VOO and SPY are ETFs, it’s important to note that Vanguard also offers VFIAX, a mutual fund that tracks the S&P 500 Index.
Trading volume
Sometimes, an investment is risky to an investor who cannot quickly liquidate it. A key indicator of the ability to quickly sell an investment is trading volume, as measured in average daily volume.
Because VOO and SPY are 3 of the world’s largest ETFs, liquidity is not an issue. As of 4/13/2022, SPY traded at a volume of about 94.6 million shares per day for the previous 30 days. Conversely, VOO traded at an average daily volume of about 5.34 million shares per day.
Finally, this analysis would be incomplete without pointing out some of the advantages that ETFs have over mutual funds.
Advantages of ETFs vs. Mutual Funds
Although they are similar, there are several key differences between ETFs and mutual funds.
Minimum investment
According to Vanguard, there is a $3,000 minimum investment to invest in VFIAX. There are usually no minimum investments to purchase an ETF. However, an investor has to be able to purchase a complete share.
There are some smaller brokerage firms, namely M1 Finance, that offer fractional ownership in ETFs. But most of them do not.
Availability
Both ETFs and the mutual fund offering are generally considered to be widely available funds.
However, mutual funds are offered in employer-sponsored retirement plans (such as 401k plans or 403b plans), so they’re more widely available to investors who do not have brokerage accounts.
Trade execution
Conversely, ETFs are more widely available during the trading day. ETFs are traded in a similar manner to stocks.
On the other hand, mutual fund trades do not get processed until the end of the trading day. This can have an impact on pricing and trade execution, particularly during stock market volatility.
The vast majority of the time, this is not an issue. However, during the coronavirus pandemic, trading was so volatile that the stock exchanges shut down several times in March and April 2020. Additionally, there were several days of significant drops.
For a long-term investor, trade execution should not matter.
Transaction costs
Many online brokerages have stopped charging transaction fees for ETFs, or charge nominal fees. On the other hand, brokerages do often charge transaction fees for mutual funds not issued by that brokerage.
For example, Vanguard will process any Vanguard mutual fund transaction free of charge. However, Schwab generally charges a $49 transaction fee for any Vanguard mutual fund transaction. But Schwab will charge nothing to trade SPY or VOO.
Where You Can Purchase VOO & SPY
You can purchase VOO & SPY through almost any online brokerage firm or through your financial advisor. If you’re looking for more diversification, you should consider a wider stock market investment, such as the Vanguard Total Stock Market Index ETF (VTI).