VTI vs VOO: A Comparison of Two Vanguard ETFs
VTI (Vanguard Total Stock Market ETF) and VOO (Vanguard S&P 500 Index ETF) are two of the most popular ETFs (exchange-traded funds) in the world. In this article, we’ll compare and contrast VTI vs VOO so you can decide which is best for you.
This article will explore both funds in depth. Specifically, we will discuss each fund’s:
- Investment focus
- Relative performance
- Investment holdings & size
- Turnover & tax impact in an investment portfolio
We’ll also give you pointers on where an average investor can purchase these funds, and what to watch out for when you set up your investment accounts.
Let’s start with what they have in common.
Contents
What VTI and VOO have in common
Each of these funds:
- Is extremely tax-efficient
- Has an extremely low expense ratio, compared to their peers
- Is a relatively better investment than active funds with similar investment objectives
As a result, both of these equity ETFs are great options for long-term investors. They especially are appealing to investors who focus on investments with extremely low costs.
Let’s now discuss one of the major differences between these two index funds: investment focus.
VTI’s Investment Focus
VTI is an index fund whose investment objective is to track (not outperform) the CRSP U.S. Total Market Index. Because VTI is an index fund, it purchases identically equal amounts of every publicly traded stock in the United States stock market.
What is the CRSP U.S. Total Market Index?
The CRSP US Total Market Index is an index created by the Center for Research in Security Prices, a recognized global leader in research-quality historical market data and returns. The US Total Market Index is the CRSP’s representation of the entire US stock market, across mega-cap, large-cap, mid-cap, and small-cap companies.
As of the quarter ending 3/31/2022, the CRSP US Total Market Index had 4,092 companies, representing approximately $45.3 trillion in market capitalization.
As of 2/28/2022, VTI held individual stocks in approximately 4,070 publicly traded U.S. companies.
VOO’s Investment Focus
Like VTI, VOO is an index fund. However, instead of tracking the broader U.S. stock market, VOO’s investment objective is to track the Standard & Poor’s 500 Index. Similarly, VOO purchases identically equal amounts of individual stocks in its index.
In VOO’s case, that would be the S&P 500 Index.
What is the S&P 500 Index?
The S&P 500 is one of the world’s oldest stock indices, and arguably one of the most famous. Created by Standard and Poor’s in 1957, the S&P 500 Index represents the 500 largest publicly traded U.S. companies.
As of the quarter ending 3/31/2022, the S&P 500 Index had 505 U.S. companies representing approximately $40.3 trillion in market capitalization.
As of 2/28/2022, VOO held individual stocks in 507 publicly traded U.S. companies.
The difference in investment focus
To pick either VOO vs VTI as the best ETF is not practical unless you look at the elements of portfolio design. Each fund has a different purpose in portfolio construction.
Going strictly by the numbers, it appears that the S&P 500 represents about 12% of the total companies in the CRSP US Total Market Index. But the S&P 500 companies comprise almost 90% of the total market capitalization of the entire U.S. equity market.
VOO would appeal to an investor who feels that they have enough exposure to small-cap stocks. That investor may choose VOO to focus on large-cap stocks with some exposure to mid-cap companies at the lower end of the index.
Conversely, VTI would appeal to an investor who is focusing on portfolio diversification. That investor probably wants to include small caps in their investment. While there is some exposure to smaller companies, the CRSP is still weighted in favor of the largest companies.
Let’s look at the holdings a little more closely.
Holdings Comparison
While the holdings of each of these funds are largely similar, we should look at them a little more closely. Let’s take a closer look at the top ten holdings in each ETF.
VTI’s Top Ten Holdings
VTI’s top ten holdings represent almost 25% of its entire market cap. As outlined in the picture below, the largest holdings are primarily from the technology sector.
However, Warren Buffett’s Berkshire Hathaway is in the top ten of the VTI ETF, as well as two health sector companies, United Health Group and Johnson & Johnson.
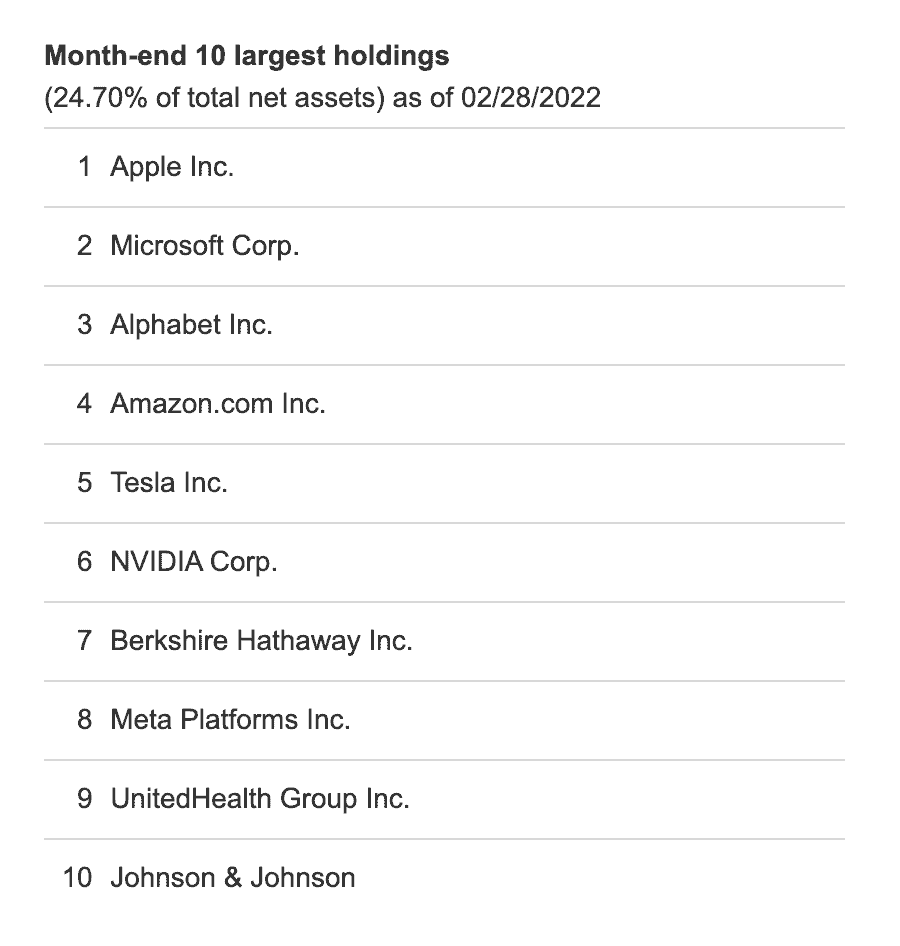
Since VTI’s top ten comprise approximately 25% of its total holdings, the remaining 75% is allocated to approximately 4,050 other companies.
VOO’s Top Ten Holdings
Like VTI, tech companies dominate VOO’s top ten holdings. In fact, this top ten list is identical to VTI’s top ten. The only difference is that VOO’s top ten comprises almost 30% of its top ten, compared to VTI’s 24.7%.
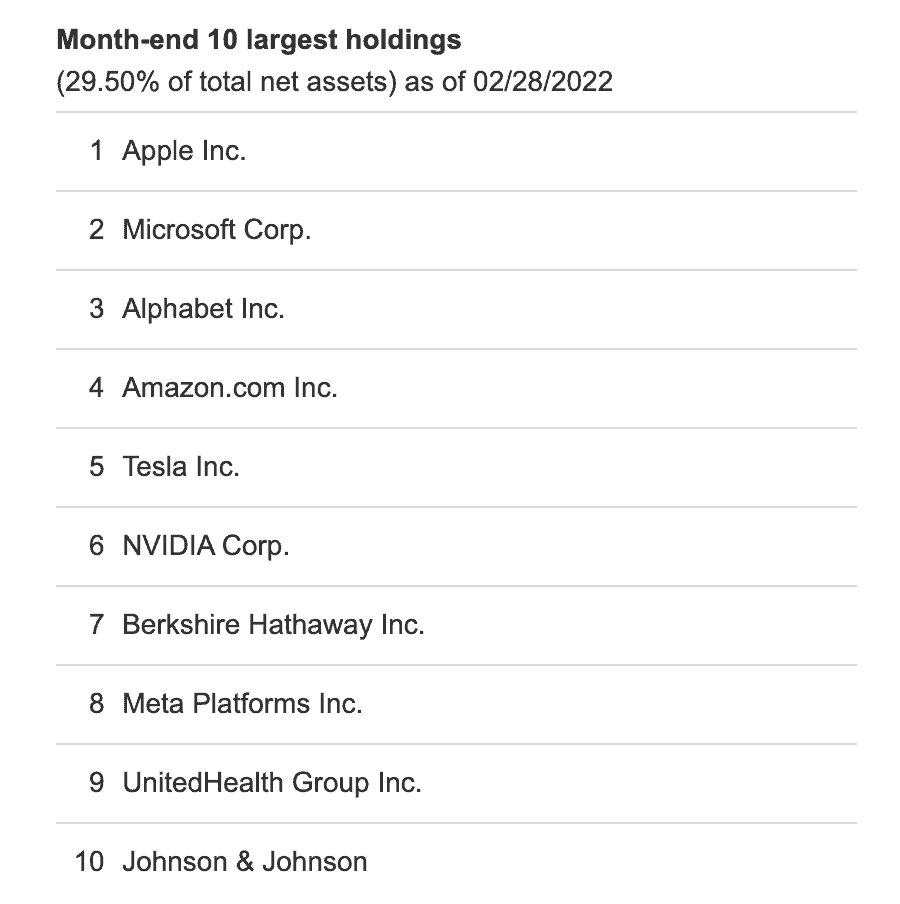
The biggest difference between the two is that VOO’s remaining 70% is allocated to the 490 or so remaining S&P 500 companies, instead of 4,000. The following chart shows the comparison again, side-by-side.
| Fund | Top 10 holdings | Remaining number of companies | Remaining companies (%) |
| VOO | 29.50% | 495 | 69.50% |
| VTI | 24.70% | 4,082 | 75.30% |
Side by side comparison of VTI’s and VOO biggest holdings as a percentage of total net assets
Let’s take a look at the overall holdings, by sector, of each fund. Each fund’s holdings is represented by a pie chart from its respective index, to make it easier to visualize.
VTI Overall Holdings
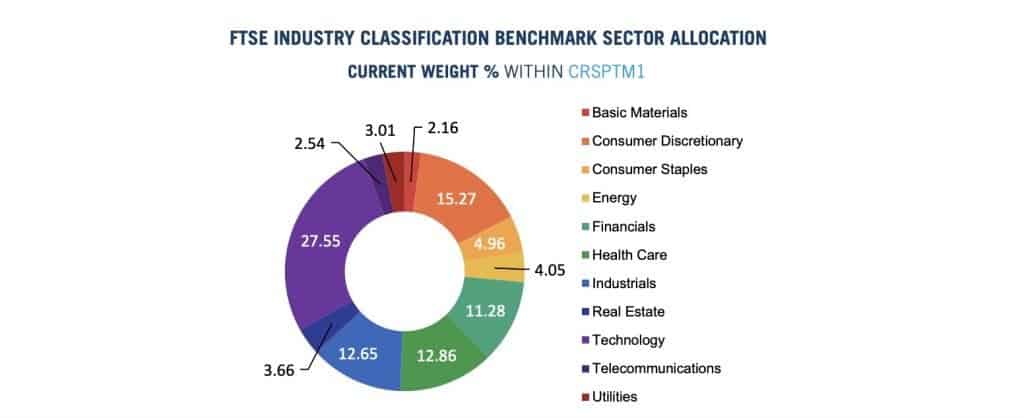
As you can see, technology companies represent a little over a quarter of the entire CRSP, followed by consumer discretionary items (15.27%), health care (12.86%), and industrials (12.65%).
Since Vanguard’s Total Stock Market ETF largely tracks the CRSP, their holdings look very similar.
VOO Overall Holdings
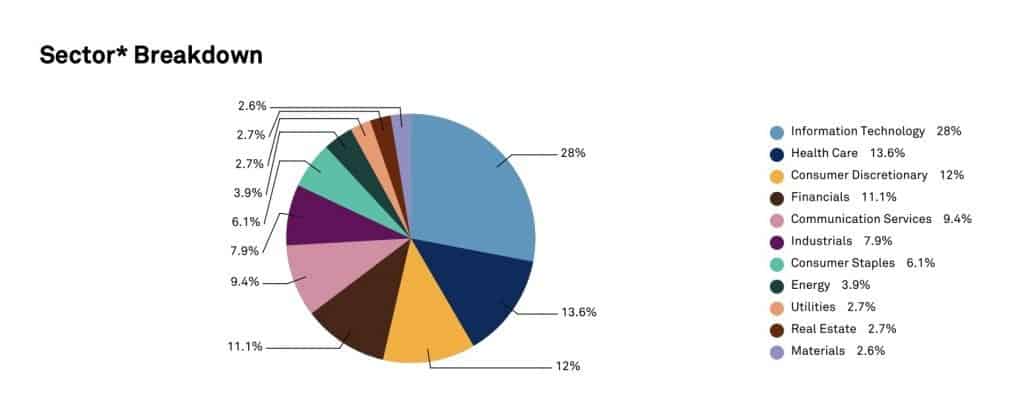
In the S&P 500, the tech sector reigns supreme (28% of holdings), followed by health care (13.6%), consumer discretionary goods (12%), and financials (11%).
A slight difference, but largely similar to the total U.S. stock market.
Holdings comparison
Although VTI provides slightly more diversification than VOO, it’s simply because the CRSP Total US Stock Index includes small cap companies. The S&P 500 focuses mostly on large cap companies.
Growth vs. value stocks
Each fund is a passive index fund. As a result, neither fund tries to achieve a slant towards growth or value. But because the S&P 500 and CRSP Total US Stock Market are both market cap indices, you might find that these funds tilt slightly more towards large-cap growth rather than value stocks.
Let’s look at the total assets under management (AUM).
AUM Comparison
Vanguard’s index funds are some of the most popular funds in the world. Whether you’re discussing mutual funds or ETFs, their low fees make them highly desired, particularly by new investors.
As they track two of the most popular stock indices, VTI and VOO are two of the largest ETFs offered by Vanguard. Going by Vanguard’s website, it’s fairly difficult to tell the true size of each ETF.
VTI
VTI weighs in at about $1.3 trillion in AUM. However, this also includes the Vanguard S&P 500 mutual fund, VFIAX.
VOO
VOO is slightly a slightly smaller fund, at $808 billion, including Vanguard’s flagship S&P 500 mutual fund, VTSAX.
ETF holdings
However, VTI and VOO are more similar in size than you would otherwise believe by looking at Vanguard’s site. According to ETF Database, which maintains a list of the top 100 ETFs by assets managed, here is the asset breakdown of each:
- VTI: $287.3 billion
- VOO: $286.6 billion
This places them as the world’s #3 and #4 largest ETFs by size. The only funds ranked ahead of VTI and VOO are both S&P 500 index funds:
- SPDR S&P 500 Index (SPY): $410.1 billion
- iShares Core S&P 500 Index (IVV): $331.3 billion
Let’s take a look at each funds’ performance, both relative to their benchmark index as well as absolute performance.
Performance comparison
Before we dive in, both VTI and VOO are passive index funds. Their goal is to track the returns for their respective indices. But these returns will always differ based on two factors: management fees & taxes.
Expense ratios
Also known as management fees, expense ratios are taken from the investment (in both cases, Vanguard) to cover the operating costs of the fund. Usually, expense ratios are reflected by an adjustment to the end of day share price.
An advantage of an index fund over similar funds is that you do not have to pay an active fund manager, investment analysts, or other staff to manage the investments. So low fees make index funds a good choice for many investors.
The expense ratio for both VTI and VOO is 0.03%. That means for every $10,000 invested, Vanguard takes $3 per year. For comparison, most financial advisors consider a fund to be relatively inexpensive if the fund’s expense ratio is less than 1% per year.
These expense ratios are in line with iShares (also 0.03%), and well below SPY (at 0.09%).
Tax drag
Mutual funds and ETFs do participate in taxable events. These taxable events include harvesting capital gains or receiving dividends from the underlying companies.
It’s hard to view the impact of taxes on annual returns because the companies do not pay taxes on these events. These transactions are passed on down to the investor.
Dividends
In most investment accounts, it’s hard to notice. But each quarter, you’ll likely see quarterly dividend transactions for each of the mutual funds or ETFs in your investment portfolio.
If your fund has a low proportion of dividend-paying stocks, you’ll likely see a relatively low payout. But in taxable investment accounts, you will pay taxes on dividends. This could be qualified dividends (subject to capital gains tax), ordinary dividends (subject to income tax at ordinary income tax rates), or a combination of both.
Capital gains distributions
And at the end of the year (usually towards the end of December), you’ll see capital gains distributions in each of your funds. The amount of distributions depends on the amount of activity in your fund.
If your fund has high turnover, you’ll likely be subject to a lot of capital gains distributions. High turnover means an active fund manager is consistently buying and selling underlying securities within the fund. Those capital gains are required to be passed on to the fundholder (that is you).
Fortunately, index funds are subject to relatively minimal turnover. Each of these indices is reset annually. And the rebalancing in the funds is done quarterly. So there isn’t a lot of buying and selling. So less impact on your performance.
You won’t see the impact of taxes on your fund’s performance. But tax efficiency should be a consideration for your overall investment performance.
Let’s take a look at the relative performance of each fund (minus management fees), compared to its underlying index.
VTI vs. CRSP Index
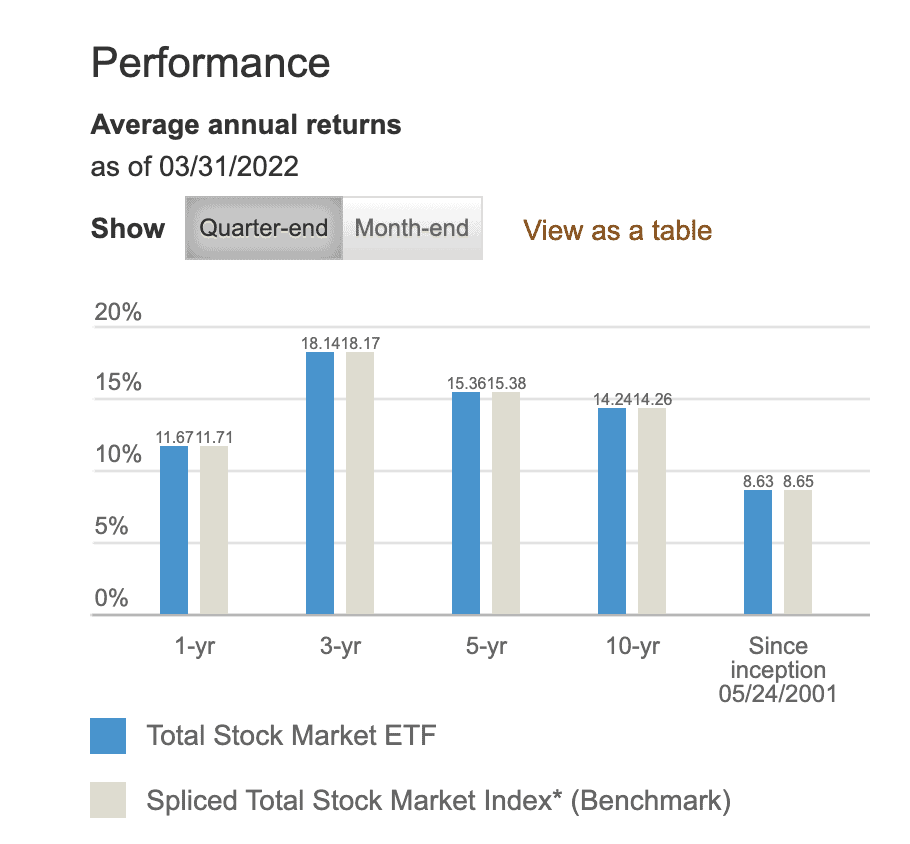
Here is the breakdown of VTI’s annual investment performance over the past year, 3 years, 5 years, past decade, and over its history:
- 1-year: 11.67%
- 3-year: 18.14%
- 5-year: 15.36%
- 10-year: 14.24%
- Since inception: 8.63%
As you can see, VTI’s performance trails slightly behind its target index, based on its expense ratio drag.
Since its inception in 2001, VTI’s average annual investment performance is 8.63%. You’ll notice ‘spliced total stock market index.’ This simply reflects the fact that VTI tracked three different stock market indices since inception:
- Dow Jones U.S. Total Stock Market Index (formerly known as the Wilshire 5000) until 2005
- MSCI US Broad Market Index (from 2005 until 2013)
- CRSP US Total Market Index (since 2013)
All three indices reflect the overall U.S. total stock market.
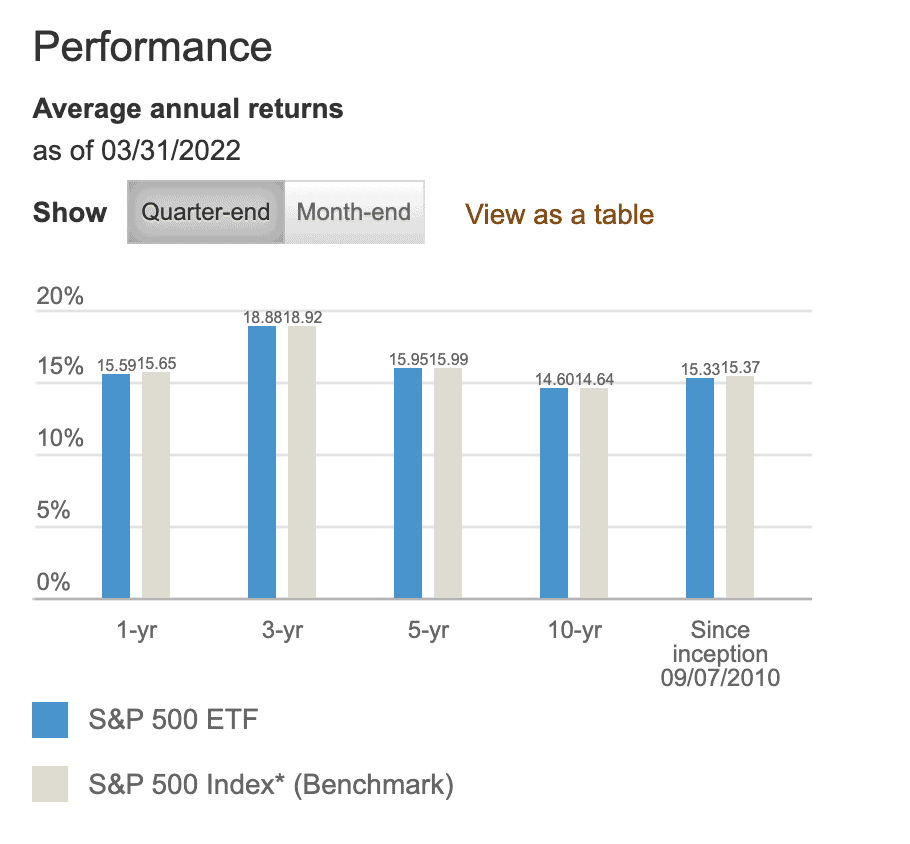
VOO vs. S&P 500 Index
Here is the breakdown of VOO’s annual investment performance over the past year, 3 years, 5 years, and over its history:
- 1-year: 15.59%
- 3-year: 18.88%
- 5-year: 15.95%
- 10-year: 14.60%
- Since inception: 15.33%
Similarly, VOO’s performance slightly trails the S&P 500 Index, with expense ratios presenting the primary difference.
Since both VOO and VTI are ETFs, it’s important to note that Vanguard also offers mutual funds that track both the S&P 500 Index and the performance of the CRSP US Total Stock Market Index.
This analysis would be incomplete without pointing out some of the advantages that ETFs have over mutual funds.
Advantages of ETFs vs. Mutual Funds
Although they are similar, there are several key differences between ETFs and mutual funds.
Minimum investment
According to Vanguard, there is a $3,000 minimum investment to invest in its Admiral fund tracking either the S&P 500 (VFIAX) or the total US stock market (VTSAX).
There are usually no minimum investments to purchase an ETF (other than being able to buy a complete share).
Availability
Both types are funds are generally considered to be widely available. However, mutual funds are offered in employer-sponsored retirement plans (such as 401k plans or 403b plans), so they’re more widely available to investors who do not have brokerage accounts.
You can purchase fractional shares of a mutual fund (like if you’re dollar-cost averaging). This generally is not available for ETFs, unless you go to a specialty brokerage firm, like M1 Finance.
Trade execution
Conversely, ETFs are more widely available during the trading day, since they are traded like stocks. Mutual fund transactions do not get processed until the end of the trading day. This can have an impact on pricing and trade execution, particularly during stock market volatility.
The vast majority of the time, this is not an issue. However, during the coronavirus pandemic, trading was so volatile that the stock exchanges shut down several times in March and April 2020. Additionally, there were several days of significant drops.
For a long-term investor, trade execution should not matter.
Transaction costs
Many online brokerages have stopped charging transaction fees for ETFs, or charge nominal fees. On the other hand, brokerages do often charge transaction fees for mutual funds not issued by that brokerage.
For example, Vanguard will process any Vanguard mutual fund transaction free of charge. However, Schwab generally charges a $49 transaction fee for any Vanguard mutual fund transaction. But Schwab will charge nothing to trade VTI and VOO.
Where You Can Purchase VTI & VOO
You can purchase VTI and VOO through almost any online brokerage firm or through your financial advisor.