VOO vs VTSAX: Which is the Best Vanguard Fund?
VOO (Vanguard S&P 500 Index ETF) and VTSAX (Vanguard Total Stock Market Index Fund Admiral Shares) are two of Vanguard’s most popular funds. Each of these Vanguard funds:
- Is extremely tax-efficient
- Has a lower expense ratio than their peers
- Is a relatively better investment than active funds with similar investment objectives
This article will explore both of these Vanguard funds in depth. Specifically, we will discuss each fund’s:
- Investment focus
- Relative performance
- Investment holdings & size
- Turnover & tax impact in an investment portfolio
We’ll also give you pointers on where an average investor can purchase these funds, and what to watch out for when you set up your investment accounts.
However, there are differences between each of these funds. First, although they both have low expense ratios, one is a mutual fund while the other is an exchange-traded fund (ETF). Also, they have different investment objectives.
Since VOO is an ETF and VTSAX is a mutual fund, we’ll start by discussing the differences between ETFs and mutual funds.
Table of contents
The differences between mutual funds and ETFs
Both ETFs and mutual funds are investment vehicles that provide individual investors a way to invest modest amounts of money into a wide variety of different assets. These assets might be bonds & CDs, equities, commodities, or other assets that an individual investor might not have access to without an investment broker.
In the case of VOO and VTSAX, those pooled investments consist solely of individual U.S. stocks. For VOO, that pool is the 500 largest U.S. companies, while VTSAX invests in the entire U.S. stock market.
Let’s look at some of the key differences between an ETF and mutual fund.
Liquidity
Liquidity is arguably the most significant difference between mutual funds and ETFs.
Mutual funds are managed by a manager. The responsible mutual fund company sells shares of a mutual fund to individual investors.
The value of these shares is also known as the net asset value (NAV). The NAV is based upon the combined value of the underlying investments. The NAV is calculated every day after the stock market has closed.
When an investor redeems a mutual fund, it is the mutual fund manager buying back those shares. But the transaction does not close until after the exchanges have closed. After market hours, the NAV is recalculated, and the mutual fund shares are redeemed at the new NAV value.
ETFs are traded on a stock exchange, in a similar manner to stocks. Since ETFs are traded on an exchange, they can be bought and sold throughout the day. Since another investor is the other party, the trade is executed immediately.
This might not be a big deal during normal times. However, does matter during times of stock market volatility. Especially when severe stock market changes force the markets to close during the trading day due to excessive selling.
For example, during the early days of the coronavirus pandemic, the entire U.S. stock market closed several times in the middle of the trading day on multiple occasions. ETF holders who wanted to sell shares could do so more quickly than mutual fund investors. As a result, most ETF investors experienced smaller declines than their mutual fund counter parts.
Tax efficiency
Index funds, whether they’re ETFs or mutual funds, can be extremely tax-efficient. But ETFs have a slight edge over their mutual fund counterparts.
When a shareholder redeems shares of a mutual fund, the manager needs to have enough cash to cover the cost of redeeming those shares. When there’s a run on the stock market, that fund manager might need to sell additional stocks to come up with the cash. Those additional sales can generate more capital gains, which are passed onto the remaining shareholders.
On the other hand, when ETF investors sell their shares, another ETF investor is buying those shares. That means there isn’t a fund manager selling assets in order to buy those ETF shares.
Differences in trade execution
There are several differences in how ETF trades work, versus mutual fund trades. Here are three ways that ETFs trade differently from mutual funds.
ETFs have different purchase minimums.
The purchase minimum for an ETF is 1 share. Since ETFs trade like a stock, most of them can be traded on any trading platform with minimal or zero transaction fees. So an investor can buy 1 share, or 5000 shares of the same ETF at the same cost.
Mutual funds usually have a minimum initial investment, in dollars. For example, when the minimum investment for new investors purchasing VTSAX at Vanguard is $3,000.
You can buy shares of VTSAX at Schwab for less than $3,000. However you would also pay a transaction fee each time. This could make that option cost-prohibitive.
It’s easier to buy fractional shares of a mutual fund
Most trading platforms will allow you to buy fractional shares of a mutual fund when purchasing a specific dollar amount. This makes dollar-cost averaging a very popular choice amongst mutual fund investorsed.
However, those same trading platforms usually require you to buy whole shares of an ETF. The main exception appears to be M1 Finance. M1 Finance allows investors to invest in fractional shares.
Finally, mutual funds are also available in more places than ETFs.
ETFs usually don’t appear in your workplace retirement plan
Because they require whole shares to be traded, you probably won’t see ETFs in a 401k or 403b plan. Honestly, their tax-efficiency is largely wasted in tax-deferred accounts.
But you’ll see mutual funds. Many times, there are different versions of the exact same mutual fund. And that’s because they often exist in different share classes.
Mutual funds have share classes
Because they don’t have a minimum, ETFs do not have a share class.
Conversely, a larger investment in a mutual fund means less risk for that fund manager. As a result, mutual funds often offer a price break for larger investments. This price break comes in the form of lower expense ratios.
For example, Vanguard’s Core-Plus Bond Fund exists in two share classes: Investor and Admiral. You can start with the Investor share class (VCPIX) at a $3,000 minimum investment, but the expense ratio is 0.30%. Admiral shares (VCPAX) have a lower expense ratio at 0.20%, but the minimum investment amount is $50,000.
VTSAX has a $3,000 minimum investment for Admiral shares, which is the only share class for that fund.
Aside from share class differences, you might see some fees in a mutual fund that you won’t usually see in Vanguard ETFs.
Mutual funds might have transaction fees
ETFs generally don’t have transaction fees, since they’re traded like stocks.
But for mutual funds, transaction fees largely depend on who is issuing the mutual fund, and how you are buying the fund.
For example, if you are a Vanguard account owner buying a Vanguard mutual fund, there are zero transaction costs. But if you’re buying that same Vanguard fund in your Schwab trading account, you’ll likely incur transaction fees.
And that’s for no-load funds. No load-funds, like Vanguard, are mutual funds that do not have a commission attached to them. But many funds charge loads, or commissions, when you
- Buy shares of the fund
- Sell shares of the fund
- Both buy and sell shares of that fund
But if you’re into dollar cost averaging, then mutual funds have an advantage over ETFs.
Let’s take a look at the investment focus of these funds.
VOO’s Investment Focus
VOO is a low-cost ETF whose investment objective is to track the Standard & Poor’s 500 Index. Both VOO purchases individual stocks from the S&P 500 Index in the proportions represented in the S&P 500 Index.
VOO focuses on replicating the S&P 500, not outperforming it. This leads us to wonder what exactly is the S&P 500 Index?
What is the S&P 500 Index?
The S&P 500 is one of the world’s oldest stock indices, and arguably one of the most famous. Created by Standard and Poor’s (now known as S&P Global) in 1957, the S&P 500 Index represents the 500 largest publicly traded U.S. companies.
As of 10/31/2024, the S&P 500 Index had 503 U.S. companies representing approximately $50.5 trillion in market capitalization. This represents about 80% of the U.S. stock market.
As of 10/31/2024, VOO held individual stocks in 504 publicly traded U.S. companies.
VTSAX’s Investment Focus
Unlike VOO, VTSAX is an indexed mutual fund that follows a different stock market index. Instead of the S&P 500, VTSAX tracks the performance of the CRSP US Total Market Index.
What is the CRSP U.S. Total Market Index?
The CRSP U.S. Total Market Index is an index created by the Center for Research in Security Prices (CRSP). CRSP is a globally recognized leader in research-quality historical market data and investment returns. The US Total Market Index is the CRSP’s representation of the entire US stock market, across mega-cap, large-cap, mid-cap, and small-cap companies.
As of the quarter ending 6/30/2024, the CRSP US Total Market Index had 3,579 companies, representing approximately $55.2 trillion in market capitalization.
As of 10/31/2024, VTSAX held individual stocks in approximately 3,644 publicly traded U.S. companies.
The difference in investment focus
To pick either VOO vs VTSAX as the best low-cost index fund is not practical unless you look at the overall investment strategy. Each of these low-cost index funds has a different purpose in an investment portfolio.
Going strictly by the numbers, it appears that the S&P 500 represents about 14% of the total companies in the CRSP US Total Market Index. But the S&P 500 companies comprise over 80% of the total market capitalization of the entire U.S. equity market.
VOO would appeal to an investor who feels that they have enough exposure to small-cap stocks in other holdings. That investor may choose VOO to focus on large-cap stocks with some exposure to mid-cap companies at the lower end of the index.
Conversely, VTSAX would appeal to an investor who does not have small-cap holdings elsewhere in their portfolio. That investor probably wants to include small caps in their investment. While there is some exposure to smaller companies, the CRSP is still weighted in favor of the larger companies.
Let’s look at the holdings a little more closely.
Holdings Comparison
While the holdings of each of these funds are largely similar, we should look at them a little more closely. Let’s take a closer look at the top ten holdings in each fund.
VOO’s Top Ten Holdings
Tech companies dominate VOO’s top ten holdings with one exception: Berkshire Hathaway, the company managed by Warren Buffett.
VOO’s top ten comprises almost 35% of its overall net assets.
VOO’s remaining 65% is allocated to the 490 or so remaining S&P 500 companies. Let’s look at VTSAX’s holdings in comparison.
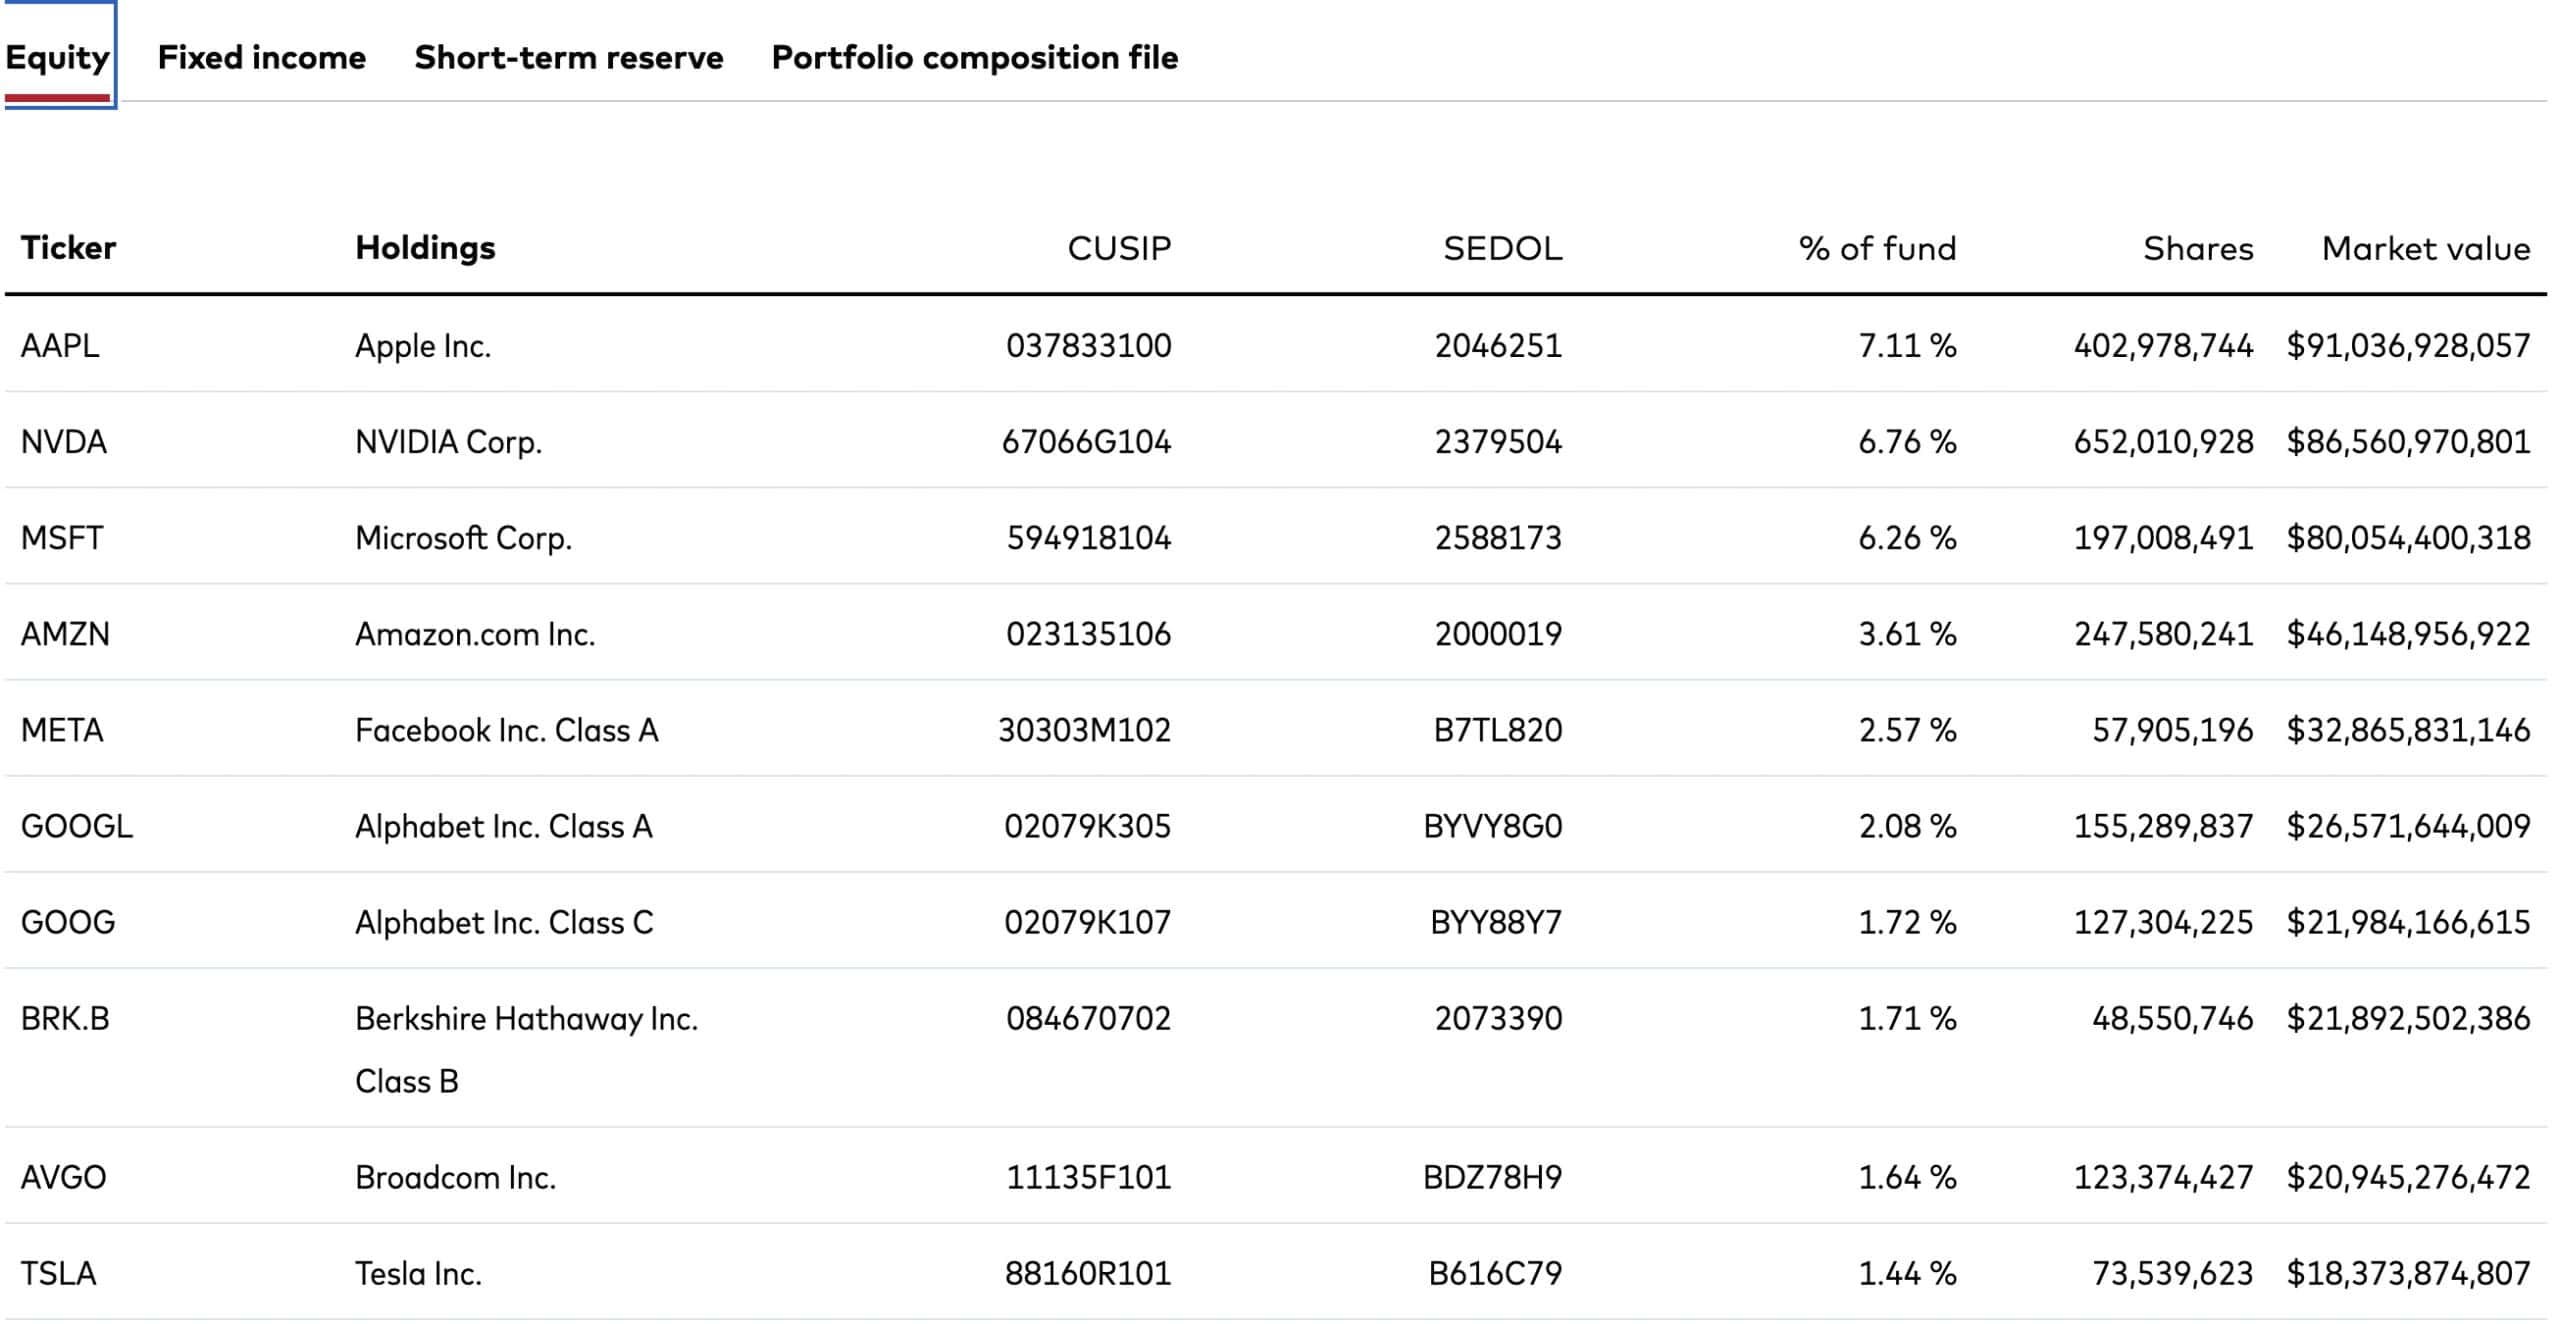
VTSAX’s Top Ten Holdings
As of October 31, 2024, VTSAX had approximately $1.7 trillion in managed assets. VTSAX’s top ten holdings represent approximately $521 billion, or a little more than 30% of its total portfolio.
As outlined in the picture below, the largest holdings are primarily from the technology sector, except for Berkshire Hathaway and Eli Lilly, one of the world’s biggest pharmaceutical companies.

Since VTSAX’s top ten comprise approximately 30% of its total holdings, the remaining 70% is allocated to approximately 3,634 other companies.
Side by side comparison
Below is a side by side comparison of the two funds.
| Fund | Top 10 holdings | Remaining number of companies | Remaining companies (%) |
| VOO | 35% | 494 | 65% |
| VTSAX | 20% | 3,569 | 80% |
Side by side comparison of VTSAX’s and VOO biggest holdings as a percentage of total net assets
Let’s take a look at the overall holdings, by sector, of each fund. Each fund’s holdings is represented by a pie chart from its respective index. This should make it easier to visualize.
VOO Overall Holdings
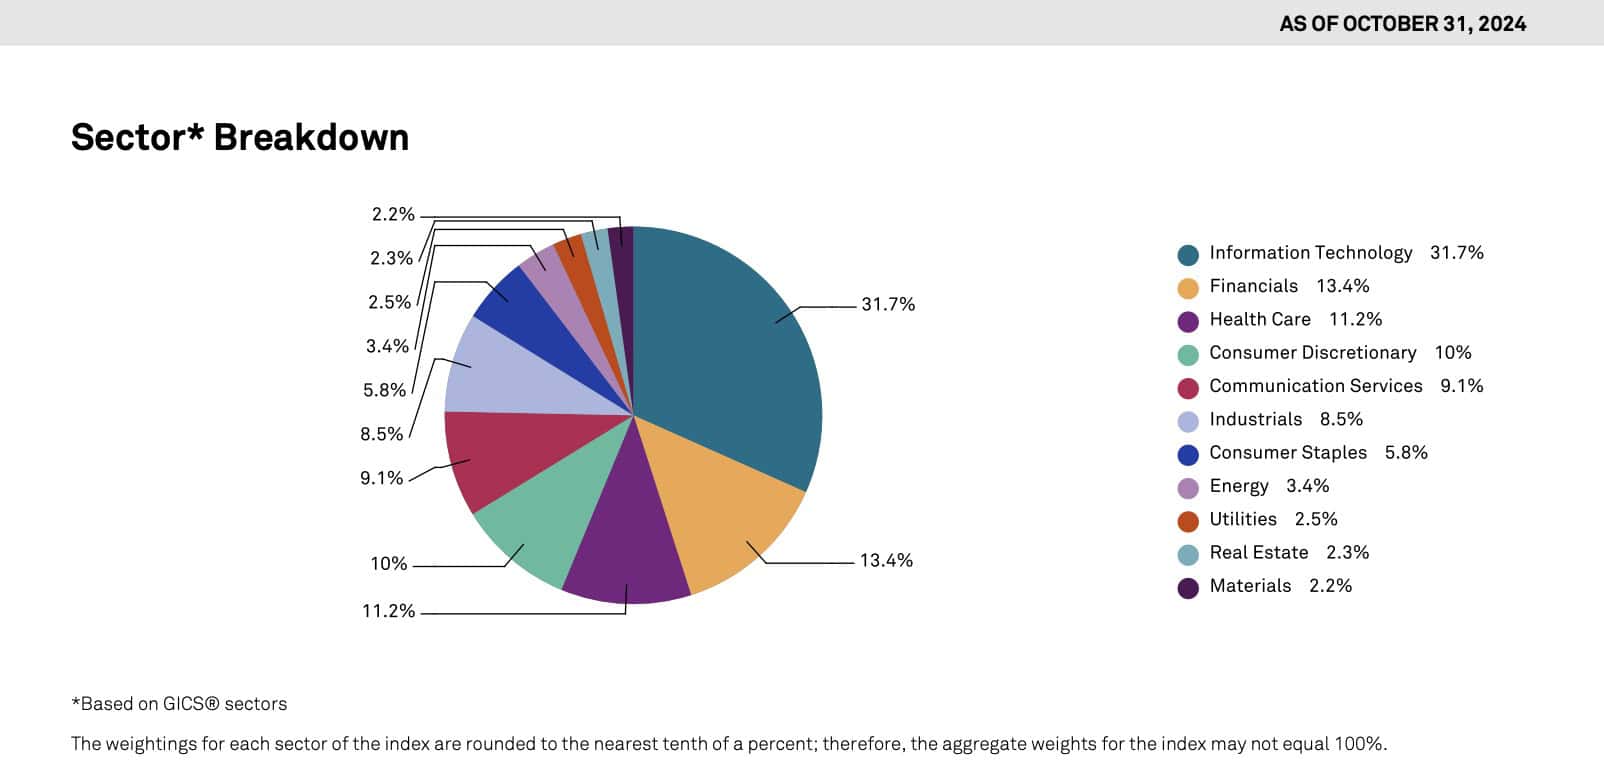
In the S&P 500, the tech sector reigns supreme (28% of holdings), followed by health care (13.6%), consumer discretionary goods (12%), and financials (11%).
A slight difference, but largely similar to the total U.S. stock market, as outlined by the CRSP representation below.
VTSAX Overall Holdings
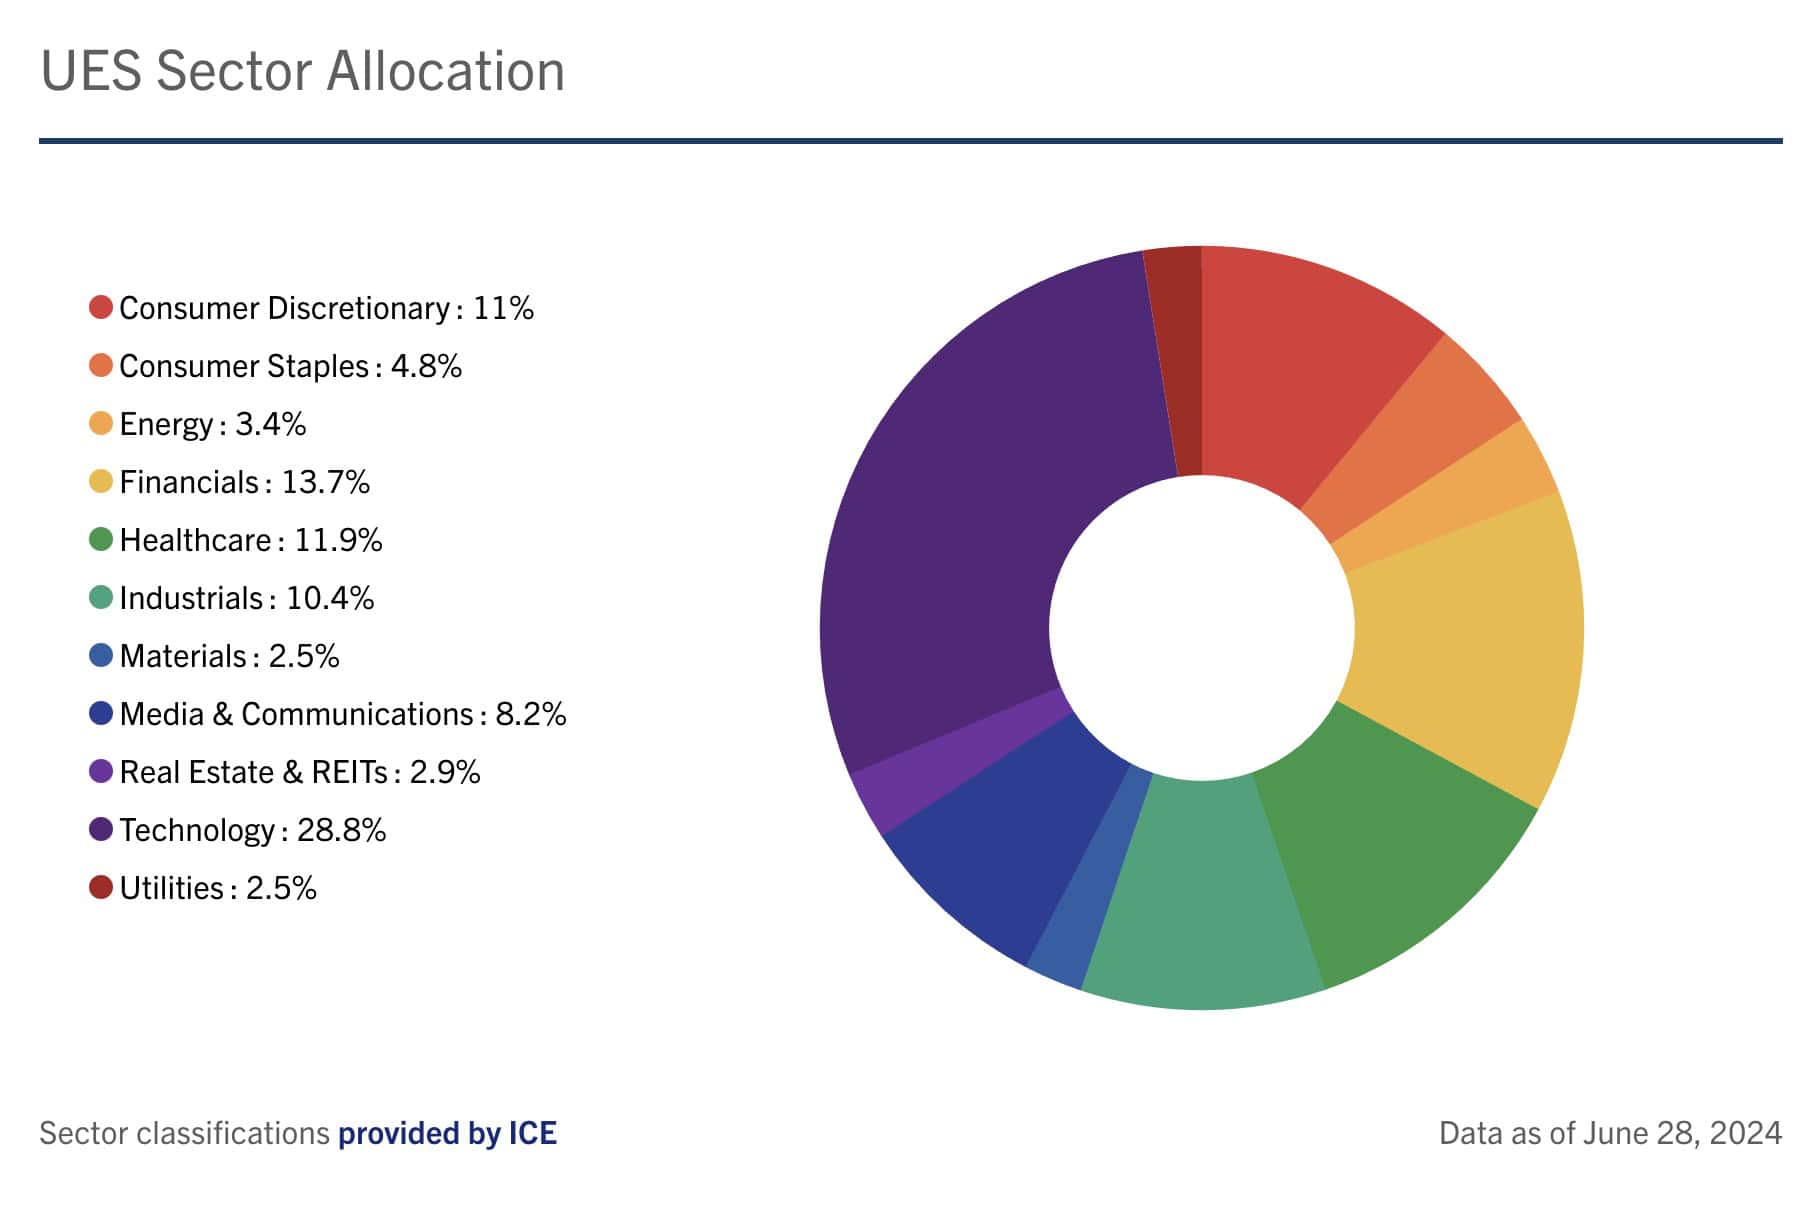
Of the different industries represented in the CRSP, technology companies compose a little over a quarter of the entire CRSP. They are followed by consumer discretionary items (15.27%), health care (12.86%), and industrials (12.65%).
Since the Vanguard Total Stock Market ETF largely tracks the CRSP, their holdings look very similar.
Holdings comparison
Although VTSAX provides slightly more diversification than VOO, it’s simply because the CRSP Total US Stock Index includes small cap companies. The S&P 500 focuses mostly on large cap companies.
Growth vs. value stocks
Each of these low-cost funds is an index fund. As a result, neither fund tries to achieve a slant towards growth or value. But because the S&P 500 and CRSP Total US Stock Market are both market cap weighted indices, you might find that these funds tilt slightly more towards large-cap growth rather than value stocks.
Let’s look at the total assets under management (AUM).
AUM Comparison
Vanguard’s index funds are some of the most popular funds in the world. Whether you’re discussing mutual funds or ETFs, their low fees make them highly desired, particularly by long term investors.
As they track two of the most popular stock indices, VTSAX and VOO are two of the largest fund holdings offered by Vanguard. VTSAX has about $1.7 trillion in net assets, while VOO is a slightly smaller fund, at $1.3 trillion.
Let’s take a look at each funds’ past performance, both relative to their benchmark index as well as absolute performance. As a disclaimer, past performance does not guarantee future results.
Performance comparison
Before we dive in, both VTSAX and VOO are passive index funds. Their goal is to track the returns for their respective indices.
But these returns will always differ based on two factors: management fees & taxes.
Expense ratios
Also known as management fees, expense ratios are taken from the investment (in both cases, Vanguard) to cover the operating costs of the fund. Usually, expense ratios are reflected by an adjustment to the end of day share price.
An advantage of an index fund over similar funds is that you do not have to pay an active fund manager, investment analysts, or other staff to manage the investments. So they can charge a very low expense ratio, which make index funds a good choice for many passive investors.
VTSAX has a slightly higher expense ratio at 0.04%, while VOO is 0.03%. That means for every $10,000 invested, Vanguard takes $4 (for VTSAX), or $3 (for VOO) per year. For comparison, most financial advisors consider a fund to be cheap if the fund’s expense ratio is less than 1% per year, or $100 for every $10,000 invested.
Tax drag
Mutual funds and ETFs do participate in taxable events. These taxable events include harvesting capital gains or receiving dividends from the underlying companies.
It’s hard to view the impact of taxes on annual returns because the companies do not pay taxes on these events. These transactions are passed on down to the investor.
Dividends
In most investment accounts, it’s hard to notice. But each quarter, you’ll likely see quarterly dividend transactions for each of the mutual funds or ETFs in your investment portfolio.
In taxable investment accounts, you will pay taxes on dividends. If your fund has a low dividend yield, you’ll likely see a relatively low tax on the dividends in your investment account. This could be qualified dividends (subject to capital gains tax), ordinary dividends (subject to income tax at ordinary income tax rates), or a combination of both.
Capital gains distributions
And at the end of the year, towards the end of December, you’ll see capital gains distributions in each of your funds. The amount of distributions depends on the amount of activity in your fund.
If your fund has a high turnover rate, you’ll probably have a lot of capital gains distributions. High turnover means an active fund manager is consistently buying and selling underlying securities within the fund. Those capital gains are required to be passed on to the fundholder (that is you).
Fortunately, index funds are subject to relatively minimal turnover. Each of these indices is reset annually. And the rebalancing in the funds is done quarterly. So there isn’t a lot of buying and selling. And this makes a huge difference in performance.
Let’s take a look at the relative performance of each fund (minus management fees), compared to its underlying index.
VOO vs. S&P 500 Index
As of 10/31/2024, this is the breakdown of VOO’s annual investment performance, compared to the S&P 500, over the past year, 3 years, 5 years, and over its history:
| Investment Time horizon | S&P 500 Return | VOO Return |
| 1-year return | 38.02% | 37.98% |
| 3 years | 9.08% | 9.04% |
| 5 years | 15.27% | 15.23% |
| 10 years | 13.00% | 12.96% |
| Since inception (9/7/2010) | 14.57% | 14.53% |
As you can see, VOO’s performance slightly trails the S&P 500 Index, with expense ratios presenting the primary difference.
It’s important to note that Vanguard also offers a mutual fund as an alternative to VOO. In fact, VFIAX, Vanguard’s S&P 500 mutual fund, also happens to be the mutual fund industry’s first index fund.
VTSAX vs. CRSP Index
Here is the breakdown of VTSAX’s annual investment performance over the past year, 3 years, 5 years, past decade, and over its history:
| Investment Time horizon | CRSP Return | VTSAX Return |
| 1-year return | 37.84% | 37.83% |
| 3 years | 7.48% | 7.47% |
| 5 years | 14.54% | 14.53% |
| 10 years | 12.40% | 12.38% |
| Since inception (11/13/2000) | 8.44% | 8.42% |
As you can see, VTSAX’s performance trails slightly behind the target index, based on its expense ratio drag.
If you’re interested in buying an ETF alternative to VTSAX, it trades under the stock ticker VTI.
Where You Can Purchase VOO & VTSAX
You can purchase VTSAX and VOO through almost any online brokerage firm or through your financial advisor.